
Infographics are an appealing way to display information. In the classroom and library, infographics are a wonderful option to reach all students when you are attempting to teach students about a particular topic.
I will be teaching a section of 8th grade Civics next academic year. In Civics we cover the three branches of government. Because this is an 8th grade course, the content just scrapes the surface and introduces students to our government structure. I chose to create an infographic using the information from one of my lectures on the Legislative Branch.
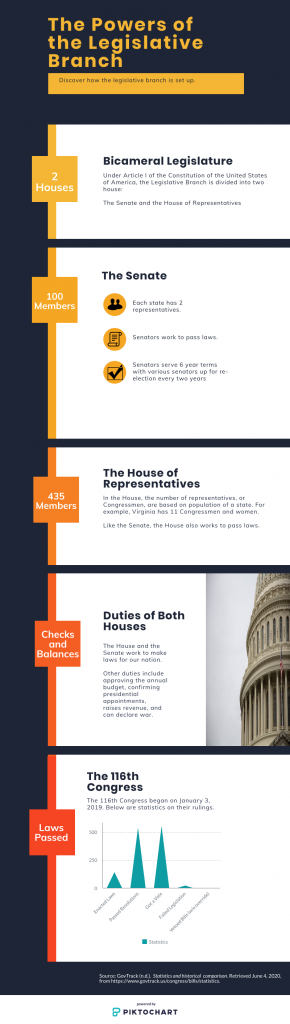
This infographic refrains from distracting students with too many shapes and design overload. It is basic but still includes updated, relevant information about the current 116th Congress.
Designing this infographic was a little overwhelming at first because there were so many templates to choose from. It was difficult to find a starting point. While browsing the infographics, I realized that I needed to decided on a topic first, then I could choose a template that best suited the subject of my infographic. Also, while creating this infographic I tried to keep in mind my audience, which is why I chose to keep the design basic and not too distracting.
As far as a librarian viewpoint, infographics would be a great way to display information about the library. In particular, you could display an infographic about how to print something, how to find and check out materials, or who you should see based on the questions a student might have (I’m thinking ITRT or IT guy, etc.).
Overall, I love creating projects like this and I plan to use more infographics as a way to present information to my students in place of a traditional PowerPoint presentation. I am already envisioning a stations activity with infographics!
2 comments for “Infographics”